top of page
"Change in context brings changes in the content" - Prof. Anil Gupta
.png)
Performance Management System
A platform to manage and visualize employee performance within organizations. This platform was designed for the employees, their managers and HR with an aim to collect relevant data to make organizational strategic decisions.
Opportunity
Employees are continuously evaluated by the employers and this data is instrumental in quantifying incentives and appraisals periodically. I was posed with a challenge to design a way for employees to visualize their performance in real-time and for the employers to monitor and collect data.
Design Process
1. Analyzing existing systems for performance management
2. Understanding the goals of employees and their needs
3. Designing user flows for various processes
4. Designing wireframes of the screens
5. User testing with employees and iterations
Insights
Results
Monthly performance reviews were in place in the form of Key Result Areas (KRA's) wherein a manager scores an employee on 5 parameters and an average score is given. This score is rated as satisfactory, not satisfactory or neutral.
Competence
Every employee is given a periodic questionnaire that maps their competence based on their job role which is a representation of skills and other learnings. This data can be used to map the growth of an employee and can be used as a tool to help an employee map their growth synchronous to desired job roles. The visualization of this data helps an employee align his/ her action towards desired job roles.
Behaviour
Mapping employee behaviour and character is a challenging task. Their teammates are the best-suited individuals to give behavioural feedback to an employee. These behavioural traits can be mapped against the company values and growth towards these values represents a healthy employee.
Solution
Results
The KRA scores of the employee and manager would be reflected every month. An average score of the two would be used to give a consolidated number colour-coded as green and red, implying acceptable and not acceptable subtly.
Competence
Employees periodically mark their competencies within various aspects as Amateur (A), Novice (N), Proficient (P) and Expert (E). This data is mapped in the form of a graph indicating the expected level of competence in each area. Employees then work on themselves to build their competence wherever they are lagging and apply for appraisals and promotions accordingly.
Behaviour
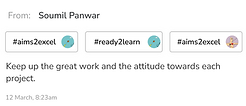
An employee gives certain hashtags to their teammates and peers periodically. These hashtags represent traits that build up towards one or more of the values defined by the company. The number and kind of hashtags are later mapped in the dashboards to visualise behavioural progress and help HR make strategic calls.


User Flows- Wireframes
Employee Dashboard
.png)
User Flow: Competency Assessment
Steps
1. Employee views past assessment summary on dashboard
2. Upon completion of the financial year or if requested by the management, an employee does a self-assessment
3. The manager views self-assessment of the employee and evaluates him/her based on his real-time performance
4. The manager can place comments on individual ratings for better communication with the employee
5. The employee can view a summary of his competence


User Flow: HR and Leadership Dashboard
Performance Management System (Mobile)
A gamified platform for employees to send and receive behavioural feedback to their peers.
Opportunity
Behavioural data in organizations is highly complicated to capture and management constantly struggles with it. A simple way to capture behavioural insights is by mobilizing peers and teammates of an employee to give feedback and build data sets unknowingly for management to evaluate and take strategic decisions.
Design Process
1. Analyzing existing systems for performance management
2. Understanding the goals of employees and their mental model around app usage
3. Designing task flows for various processes
4. Designing wireframes of the screens
Task Flows
Viewing Received Feedback
All the received feedback is tabulated in the form of a graph mapping the respective feedback against company values. The proportion of red amber and green depicts the proportion of desirable and undesirable behaviour subtly and nudges employees to reduce the red.
Giving Feedback
Similar to any messaging platform, employees can choose one or more employees to give particular feedback to. Individuals or teams could be given behavioural feedback this way by then selecting a hashtag and writing a comment for them.
View Received Feedback
All the feedback given to you by other employees can be viewed as direct feedback with the associated hashtags and comments. These feedbacks can also be arranged according to the colour of hashtags to consume good and bad feedback easily.
View Given Feedback
Feedback given by any particular employee can be viewed in the future similar to chat history from any messaging app.
.png)


Wireframes

Figma Prototype
Individual Development Program within the Performance Management System
Reflections and Learnings
1. Understood the working of HR's in a design studio
2. Understood how performance management and appraisals have a major impact to a business
3. Solutions like this could help companies retain and better manage their employees
4. I developed skills and mastered Figma and learned how important it is to bring feedback from various stakeholders
5. In such projects, often stakeholders are not aligned with a common goal. In order to help them realise what they need, a fast-moving solution helps gather better insights and to develop design goals alongside the stakeholders
.png)
Organizations run internal skill development and mentorship programs. YUJ, India was expanding their business and hiring 400 new employees that season. In order to cater to internal development of employees and help them reach their goals, YUJ decided to launch the Individual development program (IDP).
I worked on this project for 3 weeks to quickly deploy wireframes and iterate the process with 3 sprints to build a MVP concept to help the management launch their program on time.
Design Process
1. I closely worked with the CEO and the CHRO to make myself aware of their vision
2. Designed paper task flows for employees, mentors, managers and HR
3. Designed detailed wireframes and iterated based on feedback
Process Map (click to zoom)

User Flows (click to zoom)
.jpg)
Solution
In principle, the IDP is envisioned as a progress monitoring tool for an employee and his chosen mentor towards self defined goals. The employee and his mentor decide upon actionable goals and build a learning plan to achieve the goal. The platform intends to give autonomy for employees to work at a self paced progression towards their goals.
Wireframes
bottom of page